


Traditional investment management has established conventions for reporting performance and scrutinizing track records.
The financial influencer - or “finfluencer” - economy has no widely adopted equivalent. Services can define success on their own terms, leaving performance claims largely unchecked and marketing free to run amok.
The services we evaluate publish trading ideas through Discord communities, Substack newsletters, X accounts, and other channels, often behind a paid subscription.
Their core product is the trade “callout”: a message identifying a stock, option, or other instrument to buy or sell, sometimes accompanied by an entry price, profit target, stop-loss level, and subsequent updates.
Subscribers decide whether to follow those calls and execute them in their own brokerage accounts. Our rubric examines the resulting record of those calls - whether the prices were plausible, how the trades performed, and what their combined outcomes imply under explicit capital allocation assumptions.
Too often, charisma and follower counts substitute for demonstrated investment skill. Screenshots stand in for independently verified track records. Even paying subscribers often lack a complete, reliable account of the trades they were sold, the risks involved, and the value received for their subscription dollars.
Missing position-sizing instructions compound the problem. The same trades can produce radically different account outcomes depending on capital allocation and overlapping exposures. Even a complete list of trades and an accurate hit rate cannot, on their own, establish portfolio performance.
The internet has no shortage of trading receipts. What it lacks is accounting.
Speculah’s rubric is designed to close that gap.
We reconstruct the available trading record, apply explicit allocation assumptions, and examine performance, robustness, capital efficiency, and transparency. The resulting Evidence Score gives readers a common measuring stick, and an explanation of what stands behind it.
Speculah’s rubric puts those pieces back together and asks whether the resulting evidence gives customers justifiable reason to follow these finfluencers into the trades they publicize.
Our approach examines four connected questions:
Does the trading record produce competitive returns?
How robust are those results?
Does the reward justify the risk?
And can customers verify and act on what they are being sold?
We address the aforementioned questions by applying consistent allocation assumptions, comparing hindsight-optimized sizing with a modest, repeatable sizing discipline, and testing compounding across a broader range of exposures through our Speculah Profitability Index (SPI) framework.
This lets us assess both the record’s potential and its sensitivity to sizing, without attributing undisclosed allocations to the operator.
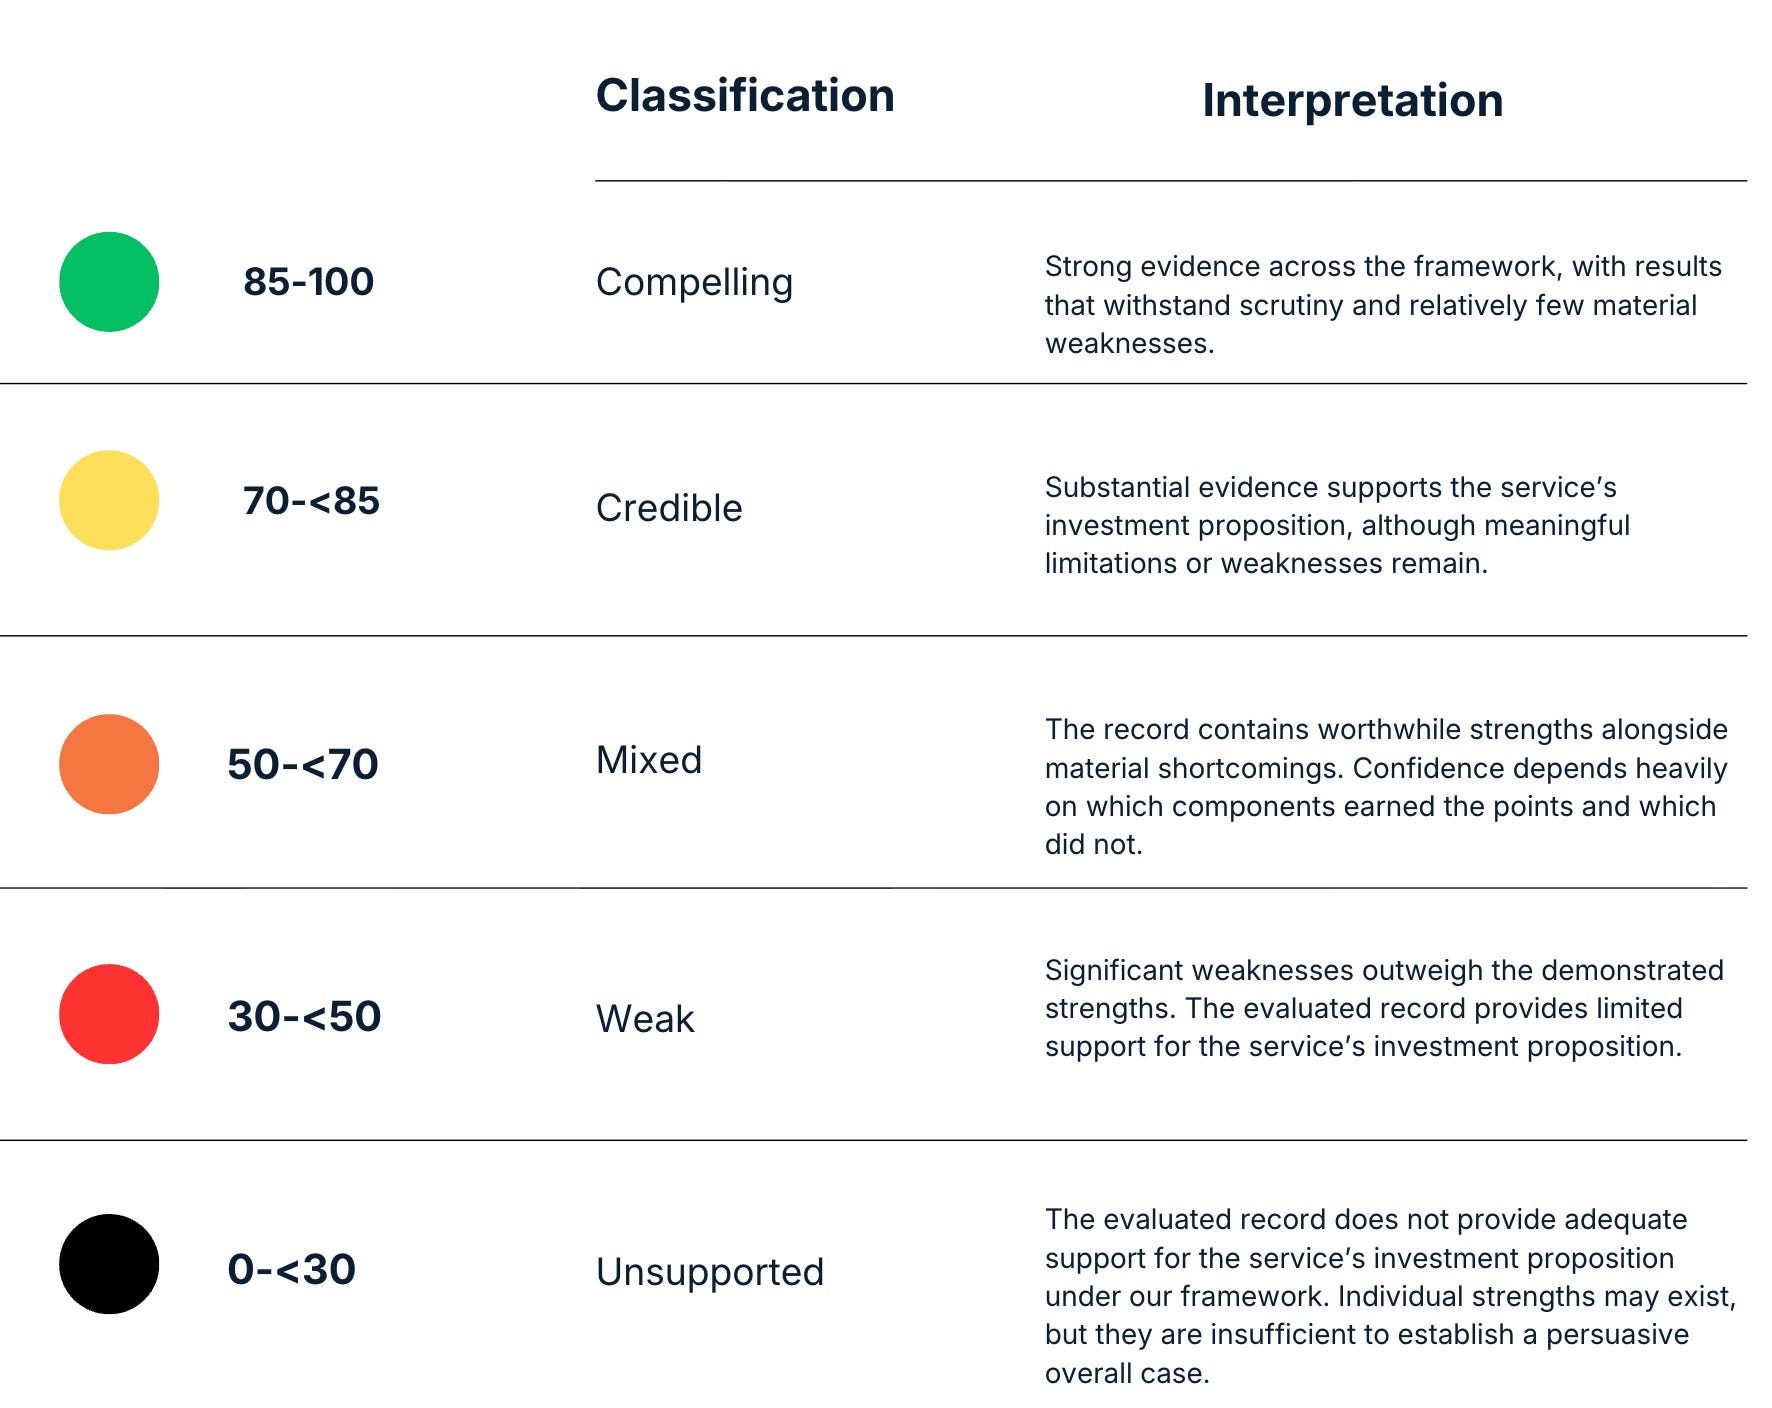
To make the results legible, each service receives an Evidence Score out of 100:
To explain how the various components work together, we’ll walk through an illustrative evaluation of a hypothetical Service A, covering 112 equity and options trades during a defined observation period.
Start with the evidence
Our data gathering process begins with subscribing to trading Discords, Substack newsletters, and other media to collect the trade alerts a finfluencer service makes available to its subscribers. What to buy or sell, when, and at what price, including subsequent adds, trims, and exits when available.
We compare reported prices with market data for the corresponding minute to assess execution plausibility. A price appearing in market data does not establish that every customer could obtain it. Spreads, liquidity, alert delays, and fast-moving markets can all affect the subscriber’s experience.
The aim is to reconstruct the available trading record and make the assumptions needed to evaluate it explicit. Missing exits, ambiguous instructions, and incomplete records affect how confidently the results can be interpreted.
Service A is a good example of how headline numbers can be misleading, making a common tension in interpreting these results immediately apparent. Most trades were winners - as evidenced by a 54.5% hit ratio (defined simply as whether a trade was profitable or not) - yet the average trade return was negative over the observation period.
That is possible because the size of the wins and losses matters as much as their frequency. Service A’s profit factor indicates that winning trades generated only 87 cents of gains for every dollar lost on losing trades.
This underscores a common misunderstanding in the investment world, which is that a majority-winning hit rate can still have losing economics on balance. The rubric examines those economics in greater depth, which we explain in some detail below.
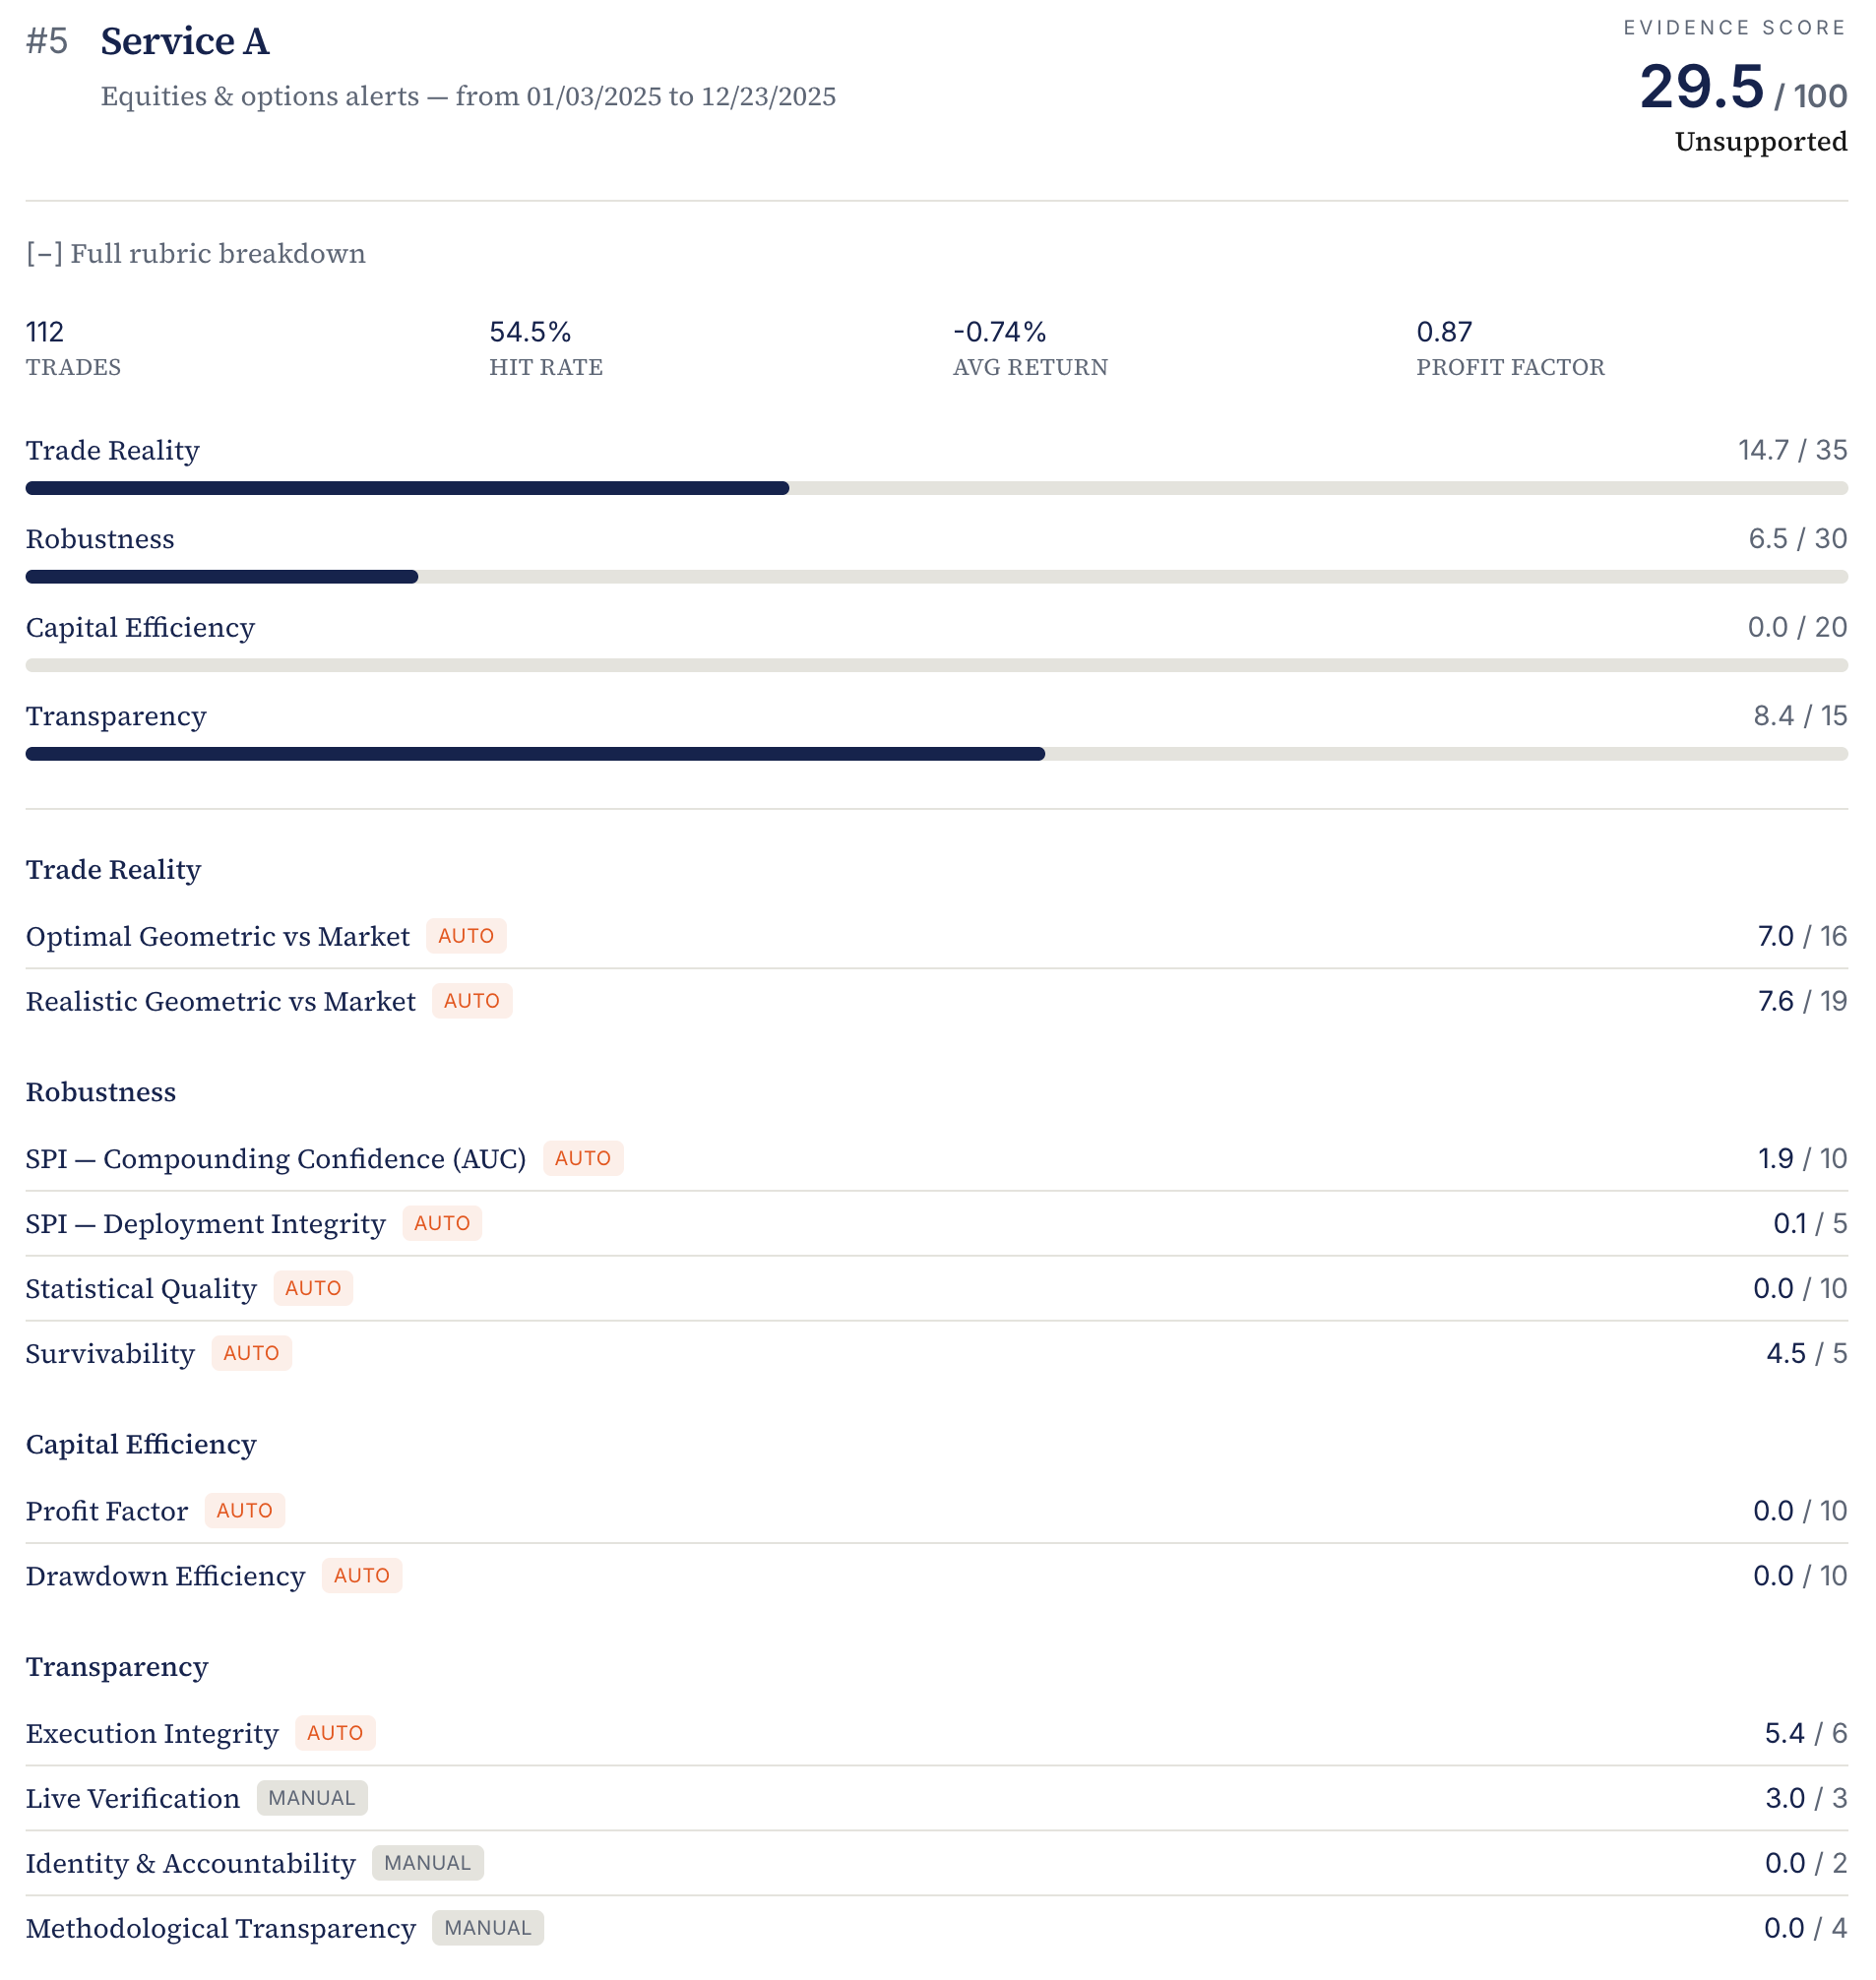
We designed the rubric to apply consistent rules wherever possible. “Auto” identifies components calculated from the reconstructed record using predefined formulas and scoring rules. “Manual” identifies components assessed by reviewers against defined criteria. Automation makes the calculations repeatable while reviewer judgment remains important in interpreting source material and resolving ambiguity.
1. Trade Reality: 14.7 out of 35
Does the trading record translate into competitive account growth?
An individual trade’s percentage return tells us what happened to that position. It does not tell us what happened to a subscriber’s account.
Account growth depends on capital allocation and compounding. We examine the record through two sizing approaches, comparing the resulting performance with the S&P 500 benchmark.
Optimal Geometric vs Market: 7.0 out of 16
This component evaluates compounded performance using a position size selected with the benefit of hindsight.
“Geometric” refers to how returns compound. Each gain or loss changes the capital available for subsequent trades. A 50% gain followed by a 50% loss leaves an account down 25%, even though the two percentages average zero.
Hindsight-optimized sizing provides a favorable historical reference point: how well did the record perform at the allocation that worked best over the observed period?
Customers cannot know that allocation in advance. Its usefulness is diagnostic, particularly when compared with the more practical sizing approach below.
Service A earns 7.0 out of 16 points. Even under favorable historical sizing, its benchmark-relative performance earns limited credit.
Realistic Geometric vs Market: 7.6 out of 19
This component evaluates compounding under a consistent, modest allocation to each trade.
It asks what the record delivers when a follower applies a repeatable sizing discipline without knowing which trades will succeed or which allocation will look best afterward.
Service A earns 7.6 out of 19 points, again falling well short of full credit.
These are rubric points, not investment returns. A score of 7.6 does not mean the account earned 7.6%.
Reading the category
The two components connect trade outcomes to account growth under different sizing assumptions. Their relationship helps reveal how dependent the strategy’s appeal is with hindsight-optimized sizing.
Service A earns less than half the available points under either approach. Its record provides limited support for a compelling investment result relative to the benchmark.
2. Robustness: 6.5 out of 30
How much confidence does the record support and how easily does it break down?
A historical return is one observed outcome. We also want to understand what happens when exposure changes, when different combinations of observed trades occur, and when losses test the account.
This category combines our Speculah Profitability Index with measures of statistical quality and survivability.
SPI - Compounding Confidence (AUC): 1.9 out of 10
How broadly does confidence in positive compounding survive across different exposure levels?
SPI examines whether the observed trade economics support continued capital growth under repeated trials.
We use 20,000 resampled trade histories to assess positive geometric growth at different allocation levels. Resampling creates alternative combinations of the observed trade outcomes, allowing us to examine more than the single historical record.
Repeating this assessment across exposure levels produces a confidence curve. The area under that curve (AUC) summarizes the breadth of support for positive compounding across the range tested.
A stronger result means confidence holds up across a broader range of allocations. A weaker result means support is generally low or concentrated within a narrow range.
Service A earns 1.9 out of 10 points. Its record provides weak support for positive compounding across the tested exposure range.
That score does not mean its probability of success is 19%. It is the credit earned under this component of the rubric.
SPI - Deployment Integrity: 0.1 out of 5
Does confidence in positive compounding survive all the way to full exposure?
Compounding Confidence examines the broader curve. Deployment Integrity focuses on its full-exposure endpoint.
This tests whether the underlying trade economics still support growth when fully exposed, rather than depending on small allocations to cushion the effects of losses.
Full exposure is a diagnostic stress test, not a recommendation that customers commit their entire account to each trade.
Service A earns 0.1 out of 5 points, receiving almost no credit for compounding confidence at full deployment.
Together, the two SPI measures examine both the breadth of compounding confidence and whether it survives at the most demanding end of the exposure range.
Statistical Quality: 0.0 out of 10
How persuasive is the evidence for a positive average trade outcome?
An average return needs context. The number of observations and the variability of outcomes affect how much confidence it deserves.
A small positive average across highly variable trades may provide little evidence of a durable edge. Service A presents a more basic problem: its observed average trade return is negative.
It therefore earns 0.0 out of 10 points. The available record does not satisfy the rubric’s requirements for statistical evidence of a positive edge.
Survivability: 4.5 out of 5
How likely is the modeled account to avoid severe capital impairment?
This component assesses the risk of substantial account damage under the tested assumptions, including losing half the account.
Service A earns 4.5 out of 5 points, a strong result.
That can coexist with weak compounding prospects. Modest exposure can help preserve an account even when the trades collectively offer unattractive economics.
Reading the category
Most of Service A’s robustness points come from survivability. It earns little credit for compounding confidence, almost none for full deployment, and none for statistical quality.
That combination is informative in that the modeled account may withstand the strategy without receiving much benefit from it.
Surviving and compounding are separate achievements.
These simulations explore the implications of the observed record. Their conclusions remain dependent on the sample and modeling assumptions. They do not establish the probabilities of future market outcomes.
3. Capital Efficiency: 0.0 out of 20
How much reward did the strategy produce for the losses it required followers to bear?
Two strategies can reach similar ending balances through very different experiences. This category examines both the balance between trading gains and losses and the return produced relative to drawdown.
Profit Factor: 0.0 out of 10
Profit factor compares aggregate gains from winning trades with aggregate losses from losing trades.
A reading above 1.0 means gains exceed losses while a reading below 1.0 means the reverse.
Service A’s 0.87 profit factor earns 0.0 out of 10 points. Its winning trades did not generate enough gains to offset its losing trades.
This is why a 54.5% hit rate offers little comfort on its own. Frequent victories do not compensate for an unfavorable balance between gains and losses.
Drawdown Efficiency: 0.0 out of 10
Drawdown efficiency assesses returns relative to the largest decline from the account’s previous peak.
The question is whether the eventual reward adequately compensated for the deterioration experienced along the way. An attractive ending balance deserves more scrutiny if reaching it required enduring substantial account damage in the process.
Service A earns 0.0 out of 10 points under the rubric’s criteria. The precise return and drawdown figures would be further explained in the accompanying evaluation as the score alone does not tell us their magnitude.
Reading the category
Profit factor examines the economics of winning and losing trades. Drawdown efficiency examines reward relative to account damage.
Service A earns no credit on either measure. Capital efficiency supplies no offsetting strength to its weak compounding results.
4. Transparency: 8.4 out of 15
Can customers verify the record, act on the alerts, and understand the service behind them?
This is Service A’s strongest category relative to the available points. The breakdown shows where that credit comes from.
Execution Integrity: 5.4 out of 6
We compare reported trade prices with contemporaneous market data. Favorable discrepancies reduce the score, with larger discrepancies carrying greater penalties.
Service A earns 5.4 out of 6 points. Its reported execution prices perform relatively well under this check.
This supports the plausibility of the reported prices. It does not establish that every subscriber could achieve them.
Live Verification: 3.0 out of 3
This component assesses whether trade calls are communicated contemporaneously, giving customers an opportunity to act.
Service A earns 3.0 out of 3 points. Its alerts satisfy the live verification criterion.
A timely call is more useful evidence than a winning trade disclosed after the opportunity has passed. Timeliness still needs to be considered alongside execution and investment results.
Identity & Accountability: 0.0 out of 2
This component considers whether the operator provides the identifying information and accountability required by the rubric. Who is behind the service? Can customers connect the operator to a verifiable real-world identity and assess their relevant background?
Service A earns 0.0 out of 2 points.
Identifiable operators give customers a basis for examining relevant background and responsibility for the service. Identity alone does not establish competence, and a zero here does not establish dishonesty. Rather, it seeks to establish basic purveyor transparency.
Methodological Transparency: 0.0 out of 4
This component assesses whether customers receive a meaningful explanation of the reasoning and decision process behind the trades.
Useful disclosure helps customers understand the thesis, what would invalidate it, and how subsequent decisions relate to the original rationale.
Service A earns 0.0 out of 4 points under the rubric’s requirements. Customers may receive timely instructions while receiving inadequate explanation of the method or rationale behind them.
Reading the category
Service A receives substantial credit for execution integrity and live verification, but none for operator accountability or methodological transparency.
Those findings deserve to remain distinct. A service can issue timely alerts at plausible prices and still provide weak investment results. It can also make its trading activity visible while leaving its decision process opaque.
How the parts inform the whole
The rubric places most of its weight on investment outcomes and their durability.
Trade Reality and Robustness together account for 65 points.
Capital Efficiency contributes 20 points for the relationship between reward and risk.
Transparency supplies the remaining 15 points for verifiability, usability, and accountability.
The value comes from reading those components together.
Service A’s majority-winning record conceals unfavorable trading economics. Its strong survivability result indicates resilience under the tested assumptions, while its weak SPI scores show little support for dependable capital growth. Its timely alerts and largely plausible execution prices earn meaningful credit, but those strengths cannot compensate for weak overall investment results.
The resulting Evidence Score is 29.5 out of 100: Unsupported.
“Unsupported” describes the support the evaluated record provides under our framework. It does not allege misconduct or imply that no subscriber could have made money by following trades in part or whole.
Two services can receive similar totals for different reasons. The breakdown explains which strengths earned credit, which weaknesses reduced confidence, and how those findings relate to the overall assessment.
We explain our material assumptions, report aggregate results, and use selected examples to illustrate how we reach our conclusions. Detailed scoring thresholds and implementation mechanics remain proprietary to limit opportunities to game the assessment.
Every evaluation applies to a defined observation period and the evidence available within it. We retain the underlying source records for verification rather than republishing subscription content wholesale.
We welcome scrutiny of our analysis and recognize the limits readers face when the underlying record sits inside a paid service. We do not assume permission to republish a subscription archive. Instead, we report aggregate findings, explain material assumptions, and use selected examples to support our conclusions.
Additionally, we invite each operator to authorize our full publication of the trade alerts and relevant updates used in their evaluation, with unrelated conversations and member information excluded. Where that authorization is provided, we can make the supporting record available for closer public examination.
Regardless of whether publication is authorized, we will investigate specific challenges, correct demonstrated errors, and explain relevant disagreements.
This is version 1.0. We expect to refine the rubric as we learn from its application over time. Material revisions will be identified so readers can distinguish changes in the framework from changes in a service’s results.
Finfluencers already have ample room to make their case. Our job is to examine how much confidence the resulting evidence earns.
Think Hard.